Over a number of years working for a large money manager with a rich history of stock picking, I became more and more enamored with the benefits of scanning for constructive price charts regardless of the broad market conditions. Earlier in my career, as I was first learning technical analysis, I devoured work by stock picking guru Mike Webster and other William O’Neil disciples who advocated for finding strong charts in any market environment.
Given that background, I was super excited this week to apply a true stock picker’s mindset, with the goal of identifying one compelling chart in each of ten S&P 500 sectors. From Communication Services to Utilities, there are plenty of interesting technical setups and nuances to discuss. And if you’re wondering why there are only ten charts instead of 11, that’s because I skipped Real Estate. It’s a smaller sector, which I tend to think of more in terms of sector rotation than specific security selection.
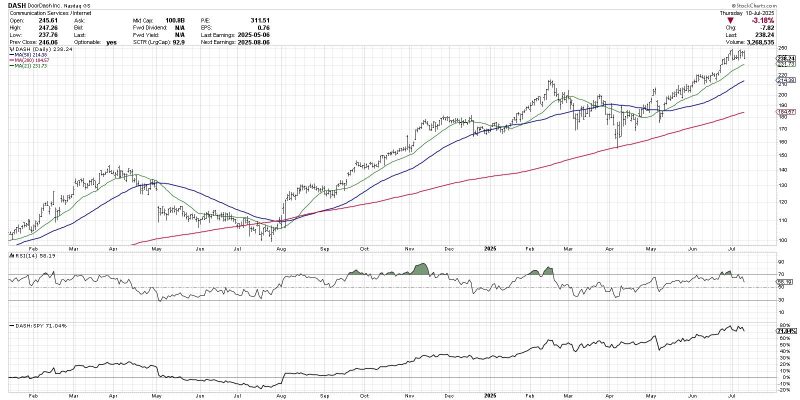
Let’s kick things off with a top-performing chart in Communication Services that is showing all the signs of accumulation.
DoorDash Inc. (DASH)
While the mega cap Magnificent 7 stocks like Meta Platforms (META) and Alphabet Inc (GOOGL) tend to grab all the headlines, I’m more intrigued by other names in this sector demonstrating positive technical characteristics. DoorDash has been making higher highs and higher lows, and remains above three upward-sloping moving averages.
The price is above the 21-day exponential moving average, which is above the 50-day simple moving average, which is above the 200-day simple moving average. Combined with strong but not excessive momentum, along with improving relative strength, and we have a chart that continues to feature bullish signs in July 2025.
Booking Holdings Inc. (BKNG)
If it seems as if DoorDash is a little too overextended, Booking Holdings is a bit earlier on in its breakout journey. Here we can see a clear resistance level around $5300, with a breakout and subsequent retest confirming a new uptrend phase.
When a chart like this shows a clear and consistent resistance level, the initial breakout can be quite tempting on the long side. The subsequent pullback to that same breakout point, followed by new support at the breakout point, serves to validate the breakout and confirm the bullish reading.
With charts like BKNG, I like to use the 21-day exponential moving average as an initial warning sign. As long as the price remains above this short-term trend mechanism, then the uptrend is still intact. If and when the price violates this moving average, that’s when I like to review the chart to determine whether the stock still deserves a place in my portfolio.
Boston Scientific Corp. (BSX)
Our final example, Boston Scientific, is one that I would argue still has a bit to prove. We can observe a clear resistance level around $107.50, which was initially set in February and then retested in May and June.
This is exactly where I would leverage the Alert Workbench on StockCharts to let me know when the price has finally broken above this crucial resistance level. I love to save potential breakout candidates to a new ChartList, and then set alerts for if and when the price finally breaks above the entry point. That way, you’re able to identify an opportunity and develop a simple trading plan up front, and then let StockCharts do the “heavy lifting” and keep a close watch on the price action in the days and weeks to come!
To see the other seven charts in all their glory, head over to the StockCharts TV YouTube channel!
RR#6,
Dave
PS- Ready to upgrade your investment process? Check out my free behavioral investing course!
David Keller, CMT
President and Chief Strategist
Sierra Alpha Research LLC
marketmisbehavior.com
https://www.youtube.com/c/MarketMisbehavior
Disclaimer: This blog is for educational purposes only and should not be construed as financial advice. The ideas and strategies should never be used without first assessing your own personal and financial situation, or without consulting a financial professional.
The author does not have a position in mentioned securities at the time of publication. Any opinions expressed herein are solely those of the author and do not in any way represent the views or opinions of any other person or entity.