One great habit to develop as an investor is regularly scanning the stock market. Whether you’re checking for stocks that are outperforming a benchmark, gapping up, reversing, or breaking out of a trading range, scanning keeps you in the loop and, importantly, helps you stay sharp and spot potential opportunities early on.
During one of our routine scans, one stock stood out: Rigetti Computing, Inc. (RGTI), a company in a fast-moving quantum computing space. On Wednesday, RGTI closed the day up 30%, which turned some heads. What’s behind the move? Rigetti announced significant improvements in its platform, better performance metrics, and the 36-qubit system, a technical milestone in the quantum world.
Should You Invest in RGTI?
If you ran any of the bullish predefined scans on StockCharts, you may have noticed RGTI popping up. That alone is a good reason to take a closer look at RGTI stock’s price action.
Looking at the daily chart of RGTI, the stock had a nice ride in late 2024. However, things cooled off in early January 2025 and, since then, the stock has been trading sideways until this week. On Wednesday, RGTI gapped up with strong volume, breaking out of that sideways range.
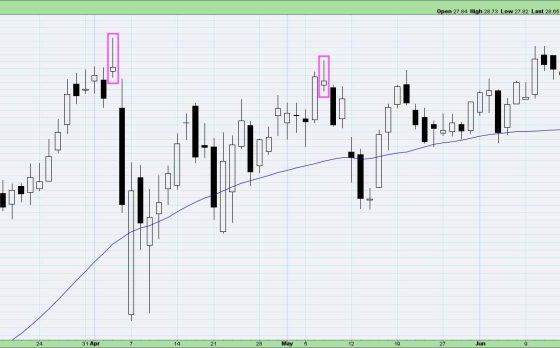
FIGURE 1. DAILY CHART OF RGTI STOCK. Since its rise in late 2024, the stock has been trading sideways until Wednesday, when it broke out of that range. Chart source: StockCharts.com. For educational purposes.
Back in June, RGTI bounced off its 50-day simple moving average (SMA), which is starting to slope upward—a healthy technical signal. With Wednesday’s price move, RGTI is above its May 27 and July 8 highs.
RGTI’s price isn’t too far from its all-time high, set in January. If the stock breaks above that level and has strong momentum, we could see it push to new highs. The Relative Strength Index (RSI) and Percentage Price Oscillator (PPO) are showing early signs of positive momentum.
On the other hand, if the stock pulls back and Wednesday’s gap up doesn’t get filled, RGTI could reverse either at the May 27 or July 8 high. A reversal with a rise in momentum would confirm an upside continuation. If RGTI falls below these levels, fills Wednesday’s gap up, and finds support at the 50-day SMA, it could go back to trading sideways, waiting for the next catalyst. A decline below the 50-day SMA would invalidate the uptrend.
A Rising Tide in Quantum Stocks?
Other stocks in the Quantum Computing space, like IonQ, Inc. (IONQ) and D-Wave Quantum, Inc. (QBTS), also saw gains on Wednesday.
Quantum computing stocks can be a bit of a roller coaster; they rallied at the end of 2024, dipped earlier this year, and are now gaining ground, thanks to encouraging news on quantum computing developments. The technology is in its early stages and could take years before it’s truly mainstream. So while these stocks are gaining attention now, the momentum may not be consistent.
If you’re a long-term investor with patience and curiosity, it may be worth adding RGTI, QBTS, ION, and others to your ChartLists. Track them regularly and watch for continued technical strength or signs of trend reversals.
Disclaimer: This blog is for educational purposes only and should not be construed as financial advice. The ideas and strategies should never be used without first assessing your own personal and financial situation, or without consulting a financial professional.